1.2 Operations on sets
Throughout this section \(U\) is the universal set.
Definition 1.18. Let \(A\) and \(B\) be sets.
- (i).
- The complement of \(A\), written \(A^c\), is everything in \(U\) that is not in \(A\): \[A^c=\{x : x\in U \text { and } x\notin A\}.\]
- (ii).
- The union \(A\cup B\) is everything in \(A\) or in \(B\) or in both: \[A\cup B=\{x : x\in A \text { or } x\in B\}.\]
- (iii).
- The intersection \(A\cap B\) is everything in both: \[A\cap B=\{x : x\in A \text { and } x\in B\}.\]
- (iv).
- The difference \(A-B\) is everything in \(A\) but not in \(B\): \[A-B=\{x : x\in A \text { and } x\notin B\}.\]
Note 1.19. The “or” in a union is inclusive — it means or both, not either but not both. This is not how “or” is always used in ordinary speech, and it is the commonest source of early mistakes.
Two relationships worth noticing at once: \[A-B=A\cap B^c,\qquad \text {and}\qquad A\cup A^c=U,\quad A\cap A^c=\varnothing .\] The first says that taking away \(B\) is the same as keeping only what is outside \(B\); it is often the easier of the two to compute with.
Definition 1.20. \(A\) and \(B\) are disjoint if \(A\cap B=\varnothing \), that is, if they have no element in common.
Example 1.21. Let \(U=\{1,2,3,4,5,6,7,8,9,10\}\), \(A=\{2,3,4,5\}\) and \(B=\{1,3,4,6\}\). Find \[\text {(a) } A^c,\qquad \text {(b) } A\cup B,\qquad \text {(c) } A\cap B, \qquad \text {(d) } A-B,\qquad \text {(e) } (A\cup B)^c.\]
Solution. (a) Everything in \(U\) that is missing from \(A\): \[A^c=\{1,6,7,8,9,10\}.\]
(b) Everything appearing in either set, each listed once: \[A\cup B=\{1,2,3,4,5,6\}.\]
(c) Only what appears in both: \[A\cap B=\{3,4\}.\]
(d) Start from \(A=\{2,3,4,5\}\) and remove anything also in \(B\); that removes \(3\) and \(4\): \[A-B=\{2,5\}.\] The same answer via \(A\cap B^c\): here \(B^c=\{2,5,7,8,9,10\}\), and intersecting with \(A\) gives \(\{2,5\}\) as before.
(e) From (b), \(A\cup B=\{1,2,3,4,5,6\}\), so \[(A\cup B)^c=\{7,8,9,10\}.\]
1.2.1 Venn diagrams
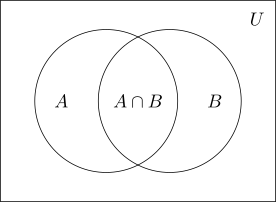
A Venn diagram draws the universal set as a rectangle and each set inside it as a circle. Overlaps show elements the sets share. They are the quickest way to see what a complicated expression means.
With three sets the picture has eight regions — seven inside the circles and one outside them all. Every element of \(U\) lies in exactly one of them, which is what makes the diagram useful for counting.
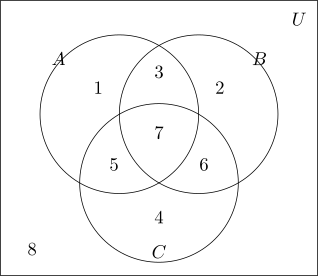
Example 1.22. Let \(U=\{a,b,c,d,e,f,g,h\}\), \(A=\{a,c,g\}\), \(B=\{b,c,f,g\}\) and \(C=\{b,d,e,f,g\}\). Find (a) \(B\cup C\), (b) \(A^c\), (c) \(A^c\cap (B\cup C)\).
Solution. (a) Collect everything in either set: \[B\cup C=\{b,c,d,e,f,g\}.\]
(b) Everything in \(U\) but not in \(A\): \[A^c=\{b,d,e,f,h\}.\]
(c) Now intersect the two answers. Work through \(A^c\) one element at a time and keep those also in \(B\cup C\): \(b\) yes, \(d\) yes, \(e\) yes, \(f\) yes, \(h\) no. \[A^c\cap (B\cup C)=\{b,d,e,f\}.\] Notice the brackets were done first. Without them, \(A^c\cap B\cup C\) would be ambiguous.
1.2.2 Counting with a Venn diagram
This is the application first-year students meet most often, and the one where a diagram is not optional — it is the method.
Example 1.23. A survey of \(200\) students asked which of Economics, Statistics and Computing they were taking. The results were:
| Economics | 90 |
| Statistics | 80 |
| Computing | 70 |
| Economics and Statistics | 35 |
| Economics and Computing | 30 |
| Statistics and Computing | 25 |
| All three | 12 |
- (a).
- Represent the information on a Venn diagram.
- (b).
- How many students take none of the three?
- (c).
- How many take exactly one?
- (d).
- How many take exactly two?
Solution. The rule that makes this work: fill the diagram from the middle outwards. The figures such as “\(35\) take Economics and Statistics” include the students who take all three, so they cannot be written straight into the diagram. Start with the centre, where the count is unambiguous, and subtract as you move out.
Step 1 — the centre. All three: \(12\).
Step 2 — exactly two. Each pairwise figure includes the \(12\) in the middle, so remove them: \begin {align*} \text {Economics and Statistics only} &= 35-12 = 23\\ \text {Economics and Computing only} &= 30-12 = 18\\ \text {Statistics and Computing only} &= 25-12 = 13 \end {align*}
Step 3 — exactly one. Each subject total includes everyone taking it, so remove the three regions already filled inside that circle: \begin {align*} \text {Economics only} &= 90-23-18-12 = 37\\ \text {Statistics only} &= 80-23-13-12 = 32\\ \text {Computing only} &= 70-18-13-12 = 27 \end {align*}
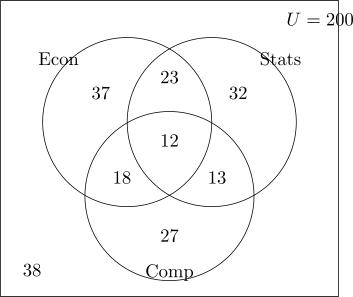
(b) Add the seven regions inside the circles: \[37+32+27+23+18+13+12=162,\] so the number taking none is \[200-162=38.\]
(c) Exactly one means the three outer regions: \[37+32+27=96.\]
(d) Exactly two means the three overlap regions, not counting the centre: \[23+18+13=54.\]
Check. The number taking at least one can also be found without the diagram, by the inclusion–exclusion principle: \[n(E\cup S\cup C)=n(E)+n(S)+n(C)-n(E\cap S)-n(E\cap C)-n(S\cap C)+n(E\cap S\cap C)\] \[=90+80+70-35-30-25+12=162,\] which agrees. Adding the three totals counts the pairwise overlaps twice, so they are subtracted; but that removes the centre three times when it was added three times, so it must be put back once. Getting \(162\) by both routes is good evidence the diagram was filled correctly.
Remark 1.24. The commonest error in this kind of question is writing \(35\) into the Economics-and-Statistics region directly. Do that and every later figure is wrong, and the eight regions will not total \(200\) — which is exactly why the total is worth checking at the end.
Questions on this section
Stuck on something here? Ask below and it stays attached to this topic.