18.1 A map of the methods

CCaTSHPEerlnitaAaffffoasdmtCneess Feioectcsicnlsts-a(7as.s c,sl)seryeo Fe asr,.,arrDcsi a FnetueuGdla(1iomstLt6npocSled.tio,im2)or diwnreytits:lanehtad xOem:LdiS ucyfi,:x ted
HmEeofftederectolssc (1 ue1nd)casotrriceitlayte:d r:o rbaunsdtom
sVe.eoff.lae,tc WiltsLit;Sy t, ces FlutGs bLteySr Hina(1gu0:s) AmRaCnH,or
EGMnAudRnoCdgeHlnakou((1s16 r1.4eg.6)r)essor: IV,
2ULSnaLitgSgerod(1o3ty)s: in ADaF shortte pstan(1e2l:)
SIAu(1rrp)el allunasdn m cooo–minBetonentsgrd,at(1ed6:.6 E)CM,
hGJBeMoiteMhanarnrossyc(e yed1n:a5 V ps)ErtiCocMbitiy:(t,1 le2offi.5gc,itie 1n4(1t.67).1)
SItCTe(1heeove)nbr,dsoia niffrt,leoee Hqtrd,eu coe scainektinclemoteecangs,tens:ra Vd, StA,UedR cPR:ouo,(nim1tss3o4s:oSd.5nLel)S
((1417).2–17.4)

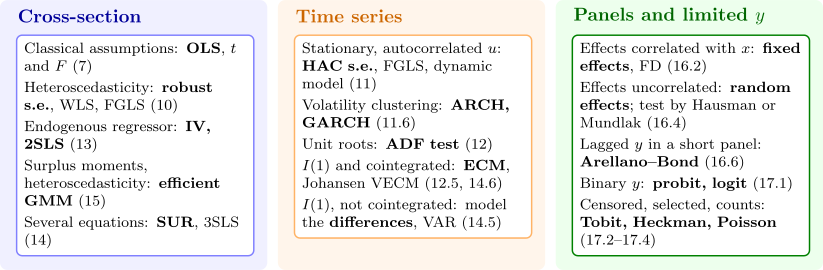
Figure 17: From the data and the problem to the method. In every column the first question is what the regressors and the disturbance are assumed to satisfy, and the second is what is lost (bias, inconsistency, or only wrong standard errors) if the assumption fails.
Questions on this section

Stuck on something here? Ask below and it stays attached to this topic.