5.1 Level Curves
There are two standard ways to picture the values of a function \(f(x,y)\). One is to draw some of its level curves, the curves in the domain along which the function has a constant value \(f(x,y) =C\). The other is to sketch a surface \(z = f(x,y)\) in space.
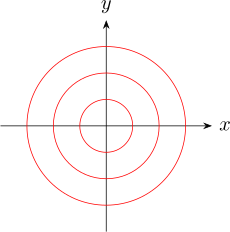
Plot the level curves \(f(x,y)= 0, \hspace {0.2cm} f(x,y) = 51\) and \(f(x,y) = 75\) in the domain of
\(f(x,y) = 100 - x^2 - y^2\).
Solution.
\(D_f = \mathbb {R}^2\)
Level Curves
\(f(x,y) = 0 \implies 100- x^2 -y^2 = 0\implies x^2 + y^2 = 100\) circle radius 10.
\(f(x,y) = 51 \implies 100 - x^2 - y^2 = 51\implies x^2 + y^2 = 49\) circle, radius 7.
\(f(x,y) = 75\implies x^2 + y^2 = 25\)
Questions on this section
Stuck on something here? Ask below and it stays attached to this topic.