12.2 A case study: primary biliary cholangitis
Primary biliary cholangitis (PBC, formerly cirrhosis) is a chronic autoimmune liver disease. Between 1974 and 1984 the Mayo Clinic ran a randomized placebo-controlled trial of the drug D-penicillamine in \(312\) patients, recording the time to death or liver transplantation and many laboratory measurements at entry (the pbc data). The analysis below uses death as the event and treats transplantation, which removes a patient from the risk of dying of the disease, as censoring, the usual convention for these data, although it could also be handled as a competing risk (the section on competing risks).
Describe and compare. There were \(65\) deaths among \(158\) patients on D-penicillamine and \(60\) among \(154\) on placebo. The Kaplan–Meier estimates of survival are \(70.8\%\) and \(71.5\%\) at \(5\) years and \(42.5\%\) and \(45.7\%\) at \(10\) years, and the log-rank test gives \(\chi ^2_1 = 0.10\), \(p = 0.75\) (Software 12.4.3). The drug does not prolong survival.
Model. The trial is still valuable as a cohort, for learning what predicts survival in PBC. The Mayo model uses age, oedema (coded \(0\), \(\frac 12\) and \(1\) for none, controlled and resistant to diuretics) and the logarithms of serum bilirubin, albumin and prothrombin time, logarithms because the effects of these skewed measurements are closer to linear on that scale. The hazard ratios are \(1.034\) per year of age, \(2.19\) for oedema resistant to treatment against none, \(1.84\) for each doubling of bilirubin, \(0.12\) for each doubling of albumin and \(8.1\) for each doubling of prothrombin time, all significant (Software 12.4.4). Bilirubin is the dominant predictor: a patient with four times another’s bilirubin has \(1.84^2 = 3.4\) times the hazard.
Check. The global test of proportional hazards gives \(p = 0.061\), with weak evidence of time-varying effects for oedema (\(p = 0.038\)) and prothrombin time (\(p = 0.021\)); with five tests, and the global test not significant, the model is acceptable, though the two effects could be split by period as in the section on checking proportional hazards if precise early and late hazard ratios were needed. The concordance index is \(0.84\), high for a prognostic model: in \(84\%\) of comparable pairs, the patient with the higher risk score died first.
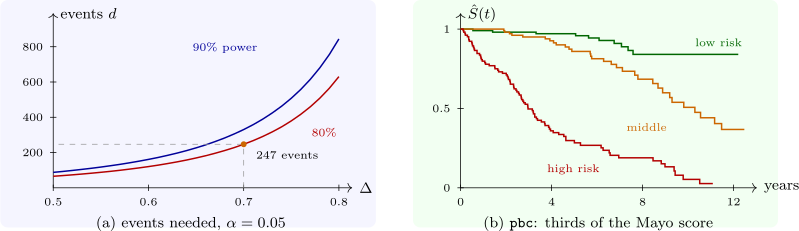
Use. Grouping patients by thirds of the risk score \(\hat \beta ^{\mathsf T}x\) separates them sharply: \(10\)-year survival is \(84\%\) in the lowest third, \(51\%\) in the middle and \(5\%\) in the highest (Figure 12). Adding treatment to the model gives an adjusted hazard ratio of \(1.15\) (\(p = 0.47\)), confirming the unadjusted result. Scores of this kind were used for years to time liver transplants, before transplantation became routine for PBC.
Questions on this section
Stuck on something here? Ask below and it stays attached to this topic.