1.1 Scatter plot
A scatter plot is a diagram that displays the values of two variables for a set of data, one point \((X_i, Y_i)\) for each observation. For the advertising data of Example 1.0.1:
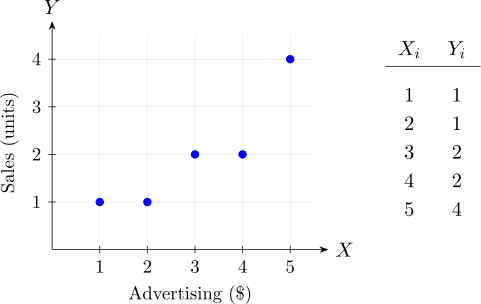
Scatter plots are used to investigate the possible relationship between the variables. Here the points rise from left to right, roughly along a straight line: more advertising goes with more sales.
A scatter plot should always be drawn before any model is fitted. It shows at a glance whether a straight line is sensible at all, and points that do not fit the pattern.
Questions on this section
Stuck on something here? Ask below and it stays attached to this topic.