5 Test for influential observations
A least-squares fit treats every observation alike in its criterion, but the observations do not have equal say in the result. A few points, usually ones at the edge of the region covered by the regressors, can determine the slope almost on their own. If they are sound, the model is still at their mercy; if they are wrong, so is the model. This section measures how much each observation drives the fit.
Two ideas must be kept apart. An observation has high leverage if its regressor values are unusual, far from the bulk of the data in \(x\)-space. Leverage depends only on \(\mathbf {X}\), not on \(y\). An observation is influential if deleting it would change the fitted model substantially. High leverage gives a point the potential to be influential; whether it is depends on where its response lies. Figure 10 shows the three cases.
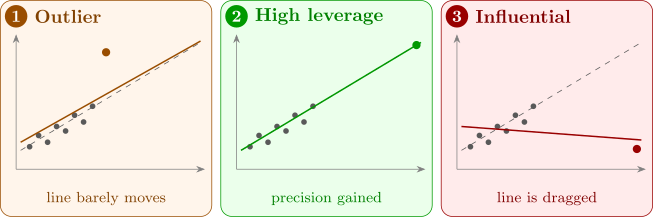
In panel 1 the point has a large residual but sits in the middle of the \(x\)-range; it raises the line a little and leaves the slope almost unchanged. In panel 2 the point is far out in \(x\) but lies on the trend of the others; it has high leverage, yet the fit is the same with or without it, and because it extends the range of \(x\) it makes the slope more precise. In panel 3 the point is far out in \(x\) and off the trend. It pulls the line round towards itself, and since the line passes close to it, its own residual is small. This last point is the dangerous one, and it is the one that residual plots are worst at revealing.
5.2 Cook’s distance
5.3 DFFITS and DFBETAS
5.4 The effect on precision: COVRATIO
5.5 Applying the measures
5.6 What to do about influential observations
5.7 Practice problems
Questions on this section
Stuck on something here? Ask below and it stays attached to this topic.