1.1 Introduction
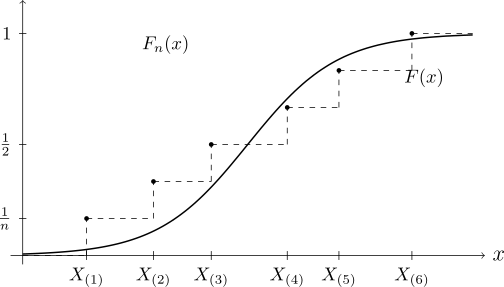
Definition 1.1.1. If the random variables \(\, X_1, X_2, \cdots , \, X_n\,\) are arranged in ascending order of magnitude
and the written as \(X_{(1)} \leq X_{(2)} \leq \cdots \leq X_{(n)}\) we call \(X_{(i)}\) as the \(i^{\text {th}}\) order statistics.
The \(X_{(i)}'\)s are dependent.
The subject of order statistics deals with the properties and applications of these order statistics
and functions involving them.
Examples are \(X_{(n)}\) (the maximum), \(X_{(1)}\) (the minimum), the range \(X_{(n)} - X_{(1)}\), the extreme deviate \(X_{(n)} - \overline {X}\, , \, \overline {X} - X_{(1)}\). For
a random sample from \(N(\mu ,\sigma ^2)\), the studentised range \(w/S_n\), where \(w = X_{(n)} - X_{(1)}\) and \(S_n\) is the sample standard
deviation.
These statistics have important applications \(X_{(n)}\) in the study of floods, \(X_{(1)}\) in the study of drought as well
as the strength and fatigue failure. The range is well known to provide a quick estimate of \(\sigma \) it is
also used in quality control.
The extreme deviate is a basic tool in detection of outliers. Studentised range is useful in detecting
outliers that are not confined to one direction, it also supplies the basis of many quick tests in
small samples and key for ranking “treatment means”.
Life tests provide an ideal illustration of advantages of order statistics in censored data. A system
of \(n\) components is called a \(k\)-out-of-\(n\) system if it functions if and only if \(k\) components function. For
components with independent lifetimes \(T_1, T_2, \cdots , T_n\), the time to failure of system is seen to be \((n - k + 1)^{\text {th}}\) order statistic
of \(T_j'\) s. If \(k = n\) , then we have \(T_{(1)} = \) the first order statistics. Connecting the components in series. If \(k = 1\), then we
have \(T_{(n)} = n^{\text {th}}\) order statistic.
Are the data really in accordance to
- (a)
- the assumed distribution
- (b)
- the assumed model.
Clues from (a) may be obtained from a plot of the ordered observations against probability plot
appropriate for the assumed distribution. Straight line fit on such a probability indicates that all is
well.
To answer (b), one can in simple cases usefully plot the ordered residuals for the fitted
model.
Questions on this section
Stuck on something here? Ask below and it stays attached to this topic.